
The Hidden Cost of Index Enthusiasm
After fifteen years of debugging slow queries at 3 AM, I’ve seen the same pattern emerge across dozens of systems: teams that treat database indexes like a magic performance bullet, adding them liberally whenever a query runs slow. The thinking seems reasonable enough. Query takes too long? Add an index. Still slow? Add another. Before long, you’re maintaining thirty-seven indexes on a table that sees heavy writes, and your INSERT performance has degraded to the point where users are timing out during peak traffic.
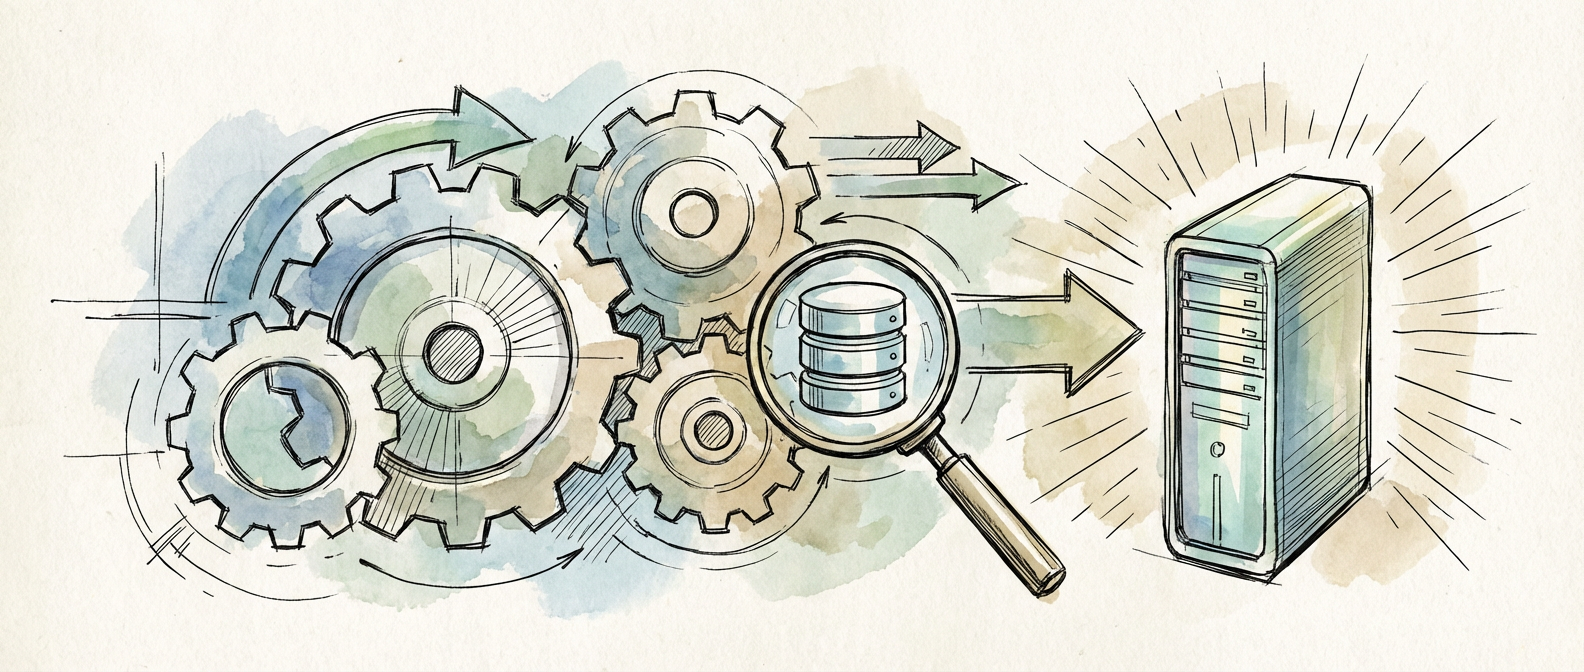
Here’s the thing most developers miss: every index you create is basically a separate data structure that must be kept in sync with your primary table. When you INSERT a row, the database engine doesn’t just write to your table. It writes to every single index that references any column in that row. Got a table with ten indexes? That single INSERT operation just became ten separate write operations, each with its own disk I/O overhead and locking drama.
I inherited a nightmare system once where the previous team had gone completely overboard, creating composite indexes for nearly every possible query they could dream up. The main transactions table had forty-two indexes. Forty-two! During peak load, INSERT operations were crawling at 200+ milliseconds, not because we needed better hardware, but because each write had to babysit four dozen secondary data structures. We spent three weeks ruthlessly cutting unused indexes, and suddenly INSERT performance jumped by 10x.

Understanding Query Execution Beyond the Obvious
The query optimizer in modern databases is pretty smart, but it’s working with information that might be completely wrong. When you write a query, the optimizer looks at multiple execution plans, estimates costs based on table statistics, and picks what it thinks will be fastest. But here’s the catch: those statistics go stale, and when they do, the optimizer keeps making decisions based on outdated assumptions.
Picture this: you have a simple JOIN between two tables, but one has exploded in size since the last statistics update. The optimizer still thinks it has 10,000 rows when it actually has 2 million. So it chooses a nested loop join instead of a hash join, and your sub-second query just became a coffee break. I’ve watched production systems where queries suddenly became 100x slower not because anyone changed the code, but because the data had grown beyond what the optimizer expected.
Running ANALYZE or UPDATE STATISTICS more often helps, sure. But you really need to understand what stats your database actually collects and how the optimizer uses them. PostgreSQL’s EXPLAIN (ANALYZE, BUFFERS) output doesn’t just show you the execution plan, it reveals actual row counts, buffer usage, and timing breakdowns. This stuff tells the real story about where your query spends its time and whether the optimizer’s guesses match reality.
Sometimes what looks like a terrible plan is actually the best choice given crappy options. Other times, a plan that looks great on paper falls apart because it’s built on assumptions that stopped being true months ago. The trick is learning to read between the lines.
The Art of Composite Index Design
Single-column indexes are pretty straightforward, but composite indexes? That’s where things get interesting. You need to understand how B-tree structures actually work and how the optimizer thinks about multi-column predicates. Get the column order wrong and your index becomes expensive storage for nothing.
Everyone knows the rule: put the most selective column first. But that’s oversimplified advice that ignores how these indexes actually get used. A composite index on (status, created_date, user_id) works great for queries that filter on status first, decent for queries that use status and created_date, and completely useless for queries that only care about created_date or user_id.
I learned this the hard way during a meltdown at a financial services company. We had this composite index on (account_type, transaction_date, amount) that worked perfectly for our main query pattern, which always filtered by account_type and date range. Life was good until the business team decided they needed reports that queried by transaction_date alone across all account types. Our beautiful index couldn’t help because account_type wasn’t in the WHERE clause, so we ended up scanning 200 million rows every time.
We had to step back and really understand our actual query patterns, not just the ones we’d originally optimized for. We ended up creating a second composite index with transaction_date leading, accepting the storage cost to support both access patterns properly. It was a good reminder that index design has to account for all your important queries, not just the most common ones.
When Normalization Becomes a Performance Liability
Look, normalization is great for data integrity and avoiding redundancy, but sometimes it creates performance headaches that just aren’t worth it. Classic example: lookup tables that force JOINs for simple queries. When you normalize status codes into their own table and then JOIN against it every time you want to show human-readable status names, you’re trading a bit of storage efficiency for a lot of query complexity.
I worked with a system once where the architects had gone full normalization zealot, creating separate tables for countries, states, cities, and postal codes, all linked with foreign keys. A simple address lookup needed four JOINs. Four! And the query optimizer was constantly struggling to find decent execution plans when these lookups got embedded in larger queries. The lookup tables were tiny, so denormalizing would barely affect storage, but the performance gain would have been massive.
Deciding when to denormalize isn’t simple. Read-heavy systems often benefit from storing computed values or flattened versions of normalized data. Write-heavy systems need to balance the convenience of denormalized reads against the pain of keeping redundant data in sync.
Modern databases give you some middle ground options. PostgreSQL’s materialized views let you precompute and store complex JOIN results, refreshing them when needed. You get the referential integrity benefits of normalization with the query performance of denormalized data. It’s not perfect, but it’s often a reasonable compromise.
Measuring What Actually Matters
Database performance optimization without good measurement is just guessing, yet most teams obsess over metrics that don’t tell them much about user experience. Average query time lies to you when outliers skew the numbers. CPU utilization tells you about resource usage but not whether your queries are actually fast enough.
What you really need to watch are percentile-based response times, especially 95th and 99th percentiles. These show you how your worst queries affect users. A system where 95% of queries finish in 10ms but 5% take 30 seconds has a serious problem that average response time will completely hide.
Lock contention and blocking queries cause more visible problems than slow individual queries. When some long-running transaction grabs locks that block dozens of other queries, the whole system can seize up. Monitoring blocked query counts and lock wait times gives you early warning before everything goes sideways.
Every database has its own personality based on schema design, query patterns, and hardware quirks. The tricks that saved your last system might make things worse in your current one. You have to put in the time to understand your specific bottlenecks.
These principles have helped me through countless 3 AM emergencies, but every database throws new curveballs that require fresh analysis. What performance nightmares are you dealing with right now? I’m curious about the specific bottlenecks you’re hitting and how you’re approaching the detective work.